Class Engagement interface overview
To launch the Class Engagement tool, navigate to a course home page containing the Course Overview widget and then click View Class Engagement.
Tip: You can also navigate to the Class Engagement tool from the Classlist tool.
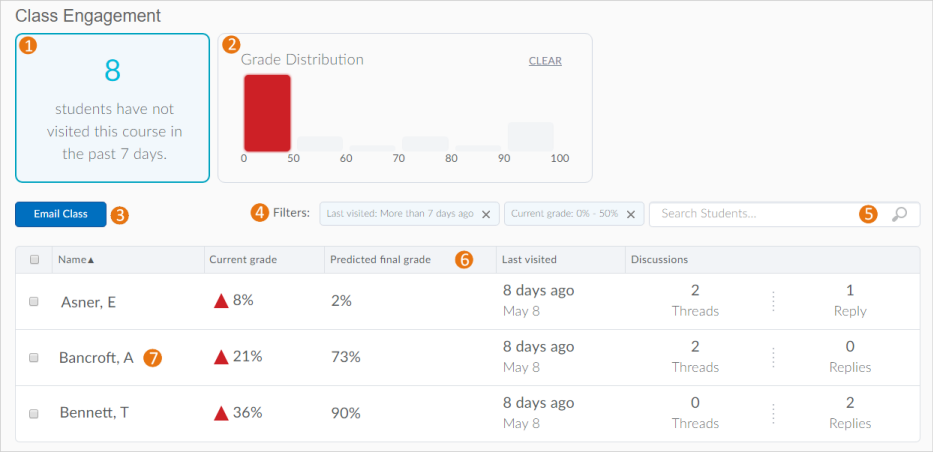
- To alert instructors about low class engagement, a notification tile indicates the number of learners who have not visited the course in the last 7 days. Clicking the tile filters the class list to display the learners who have not accessed the course during this period of time.
- To view course progress at a glance, a bar chart tile displays the grade distribution within the course, with each bar representing a grade range. Clicking a bar filters the class list to display the learners in that grade range. To dismiss the filter, click Clear.
- Instructors can easily contact the entire class by clicking Email Class or selected learners by clicking Email selected.
Note: When you send email to the entire class or selected learners, the To field in the Compose New Message dialog box automatically populates with email addresses that are registered in Brightspace Learning Environment. You cannot send email to unregistered email addresses that you manually add in the To field. - Clear visual indicators display when filters are applied to metrics. For example, clicking a range in the grade distribution tile displays the Current grade filter with the specified grade range.
Instructors can dismiss an active filter they are no longer interested in by clicking X in the filter.
If multiple, discontinuous grade ranges are selected in the grade distribution tile, the Current grade filter displays without a grade range. - Use the search bar to filter the class list by learner name. You can type a name, user ID, or learner number.
- A class list in table format displays the following information for each enrolled learner:
- Name (full name and Brightspace Learning Environment user name)
- Current grade
- Predicted final grade (only appears if S3 is installed and predictions are generated for the course)
- Last visited (date of the last course visit)
- Discussions (indicates the number of threads started by each user and the number of replies posted by each user)
- Clicking a table entry displays more information in the Class Progress tool. For example, clicking a user’s name displays the Progress Summary in the Class Progress tool, which provides detailed information about course progress using tracking indicators such as objectives, quizzes, surveys, and login history.