Seating Chart enables you to assign students to seats representative of your classroom and track student performance on a session-by-session basis.
Seating Chart integrates with both the Locations and Calendar tools. Because seating charts are dependent on Locations, you must first create or activate a location with a layout before you can create any seating charts. See About Locations for more information. Once you create a seating chart, you can attach it to an event in your course calendar. This enables you to hold a session in Learning Environment and communicate seating to students before the session occurs. You can use Seating Chart in conjunction with Locations and Calendar to enhance instructors' experiences teaching in live classrooms, enabling them to track students' comments and participation quickly and easily.
Students can see their seating charts on the calendar Agenda page. They can view their assigned seating and print the chart directly from the event. Students do not see any attendance, participation data, or comments when viewing a seating chart.
When you add an event to a seating chart with a location, it is called a session. You can track attendance and participation for sessions and make student-specific comments. Sessions are accessible from both Calendar and Seating Chart.
You can create a session by scheduling an event in a location associated with a seating chart in Calendar.
For more information about sessions, see Creating sessions and Managing sessions.
Tip Track in-class sessions live using a tablet and the supported Desktop Web browser.
Seating Chart uses color coding – red, yellow, and green – when viewing a session to help distinguish student progress.
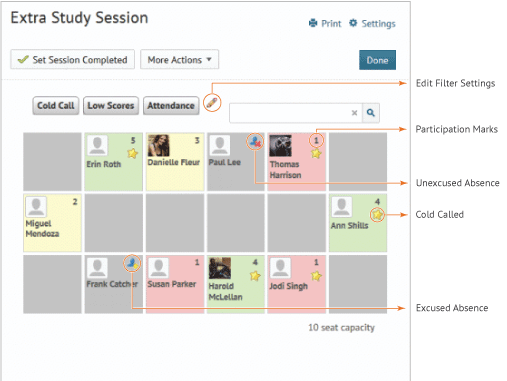
Session view
Note Click the ![]() Settings icon to edit the Positive and Negative Threshold values.
Settings icon to edit the Positive and Negative Threshold values.
On the main Seating Chart page, the Overall Statistics sidebar displays the attendance, participation, and cold call statistics for the entire course, in addition to group session statistics.
On the individual Seating Chart pages, the Students sidebar displays a list of all the students in the course. Use the context menu to quickly sort students based on overall participation, cold calls, attendance results, and first or last name. You can sort by lowest to highest scores or vice versa by clicking on the ![]() upward-facing or
upward-facing or ![]() downward-facing arrows. The option that you choose loads by default the next time you launch the Seating Chart tool. To view a student's individual statistics and comments for a seating chart, click on their name. You will see the student's profile, as well as the statistics for all of their sessions for that seating chart.
downward-facing arrows. The option that you choose loads by default the next time you launch the Seating Chart tool. To view a student's individual statistics and comments for a seating chart, click on their name. You will see the student's profile, as well as the statistics for all of their sessions for that seating chart.
